Shader debug Printf
| The source for this sample can be found in the Khronos Vulkan samples github repository. |
Overview
This sample demonstrates the usage of the VK_KHR_shader_non_semantic_info for adding means to output debug messages from SPIR-V shaders using a print function at runtime.
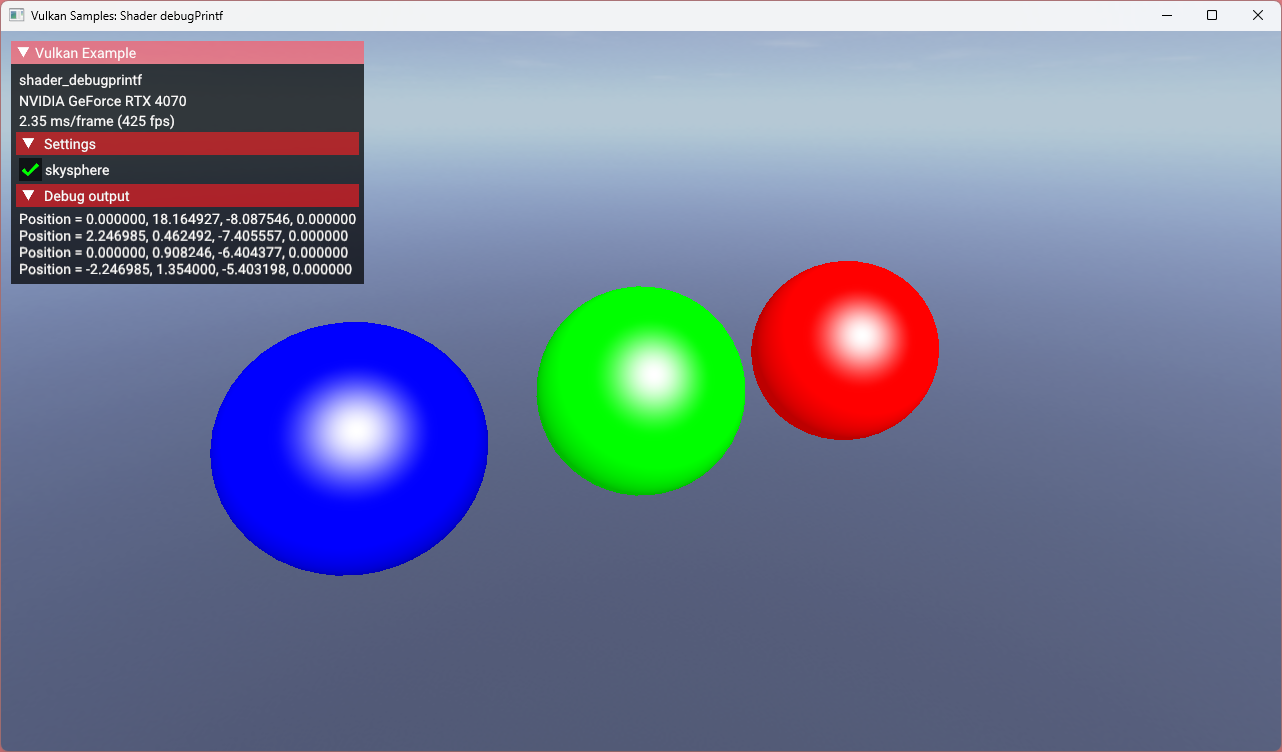
It allows you to output invocation related debug messages from a given shader stage and can help to find problems or bugs together with a graphics debugger like RenderDoc. But it’s also possible to display that data in your application (e.g. a debug window or the command line), although this has some limitations like a fixed buffer size that all messages need to fit in.
(Debug) Printf for shaders
With this extension properly setup you can use Printf statements (which exist in some form in most CPU side programming languages) in a shader to output messages from the current invocation of the shader (e.g. the current vertex processed in the vertex shader or the current fragment produced in the fragment shader). This lets you output values specific to that single invocation, adding a way of e.g. finding bugs or problems that only occur in certain invocations of execution parts of a shader.
For example outputting the transformed vertex positions in a vertex shader could look like this in glsl:
void main()  {
	vec4 outPosition = ubo.view * ubo.model * inPosition;
	debugPrintfEXT("Transformed position = %v4f", outPosition);
}
And like this in HLSL:
VSOutput main(VSInput input) {
	float4 output.Position = mul(ubo.view, mul(ubo.model, input.Position));
	printf("Transformed position = %v4f", output.Position);
}
Setup
Shader printf is a feature of the validation layers. So the first step is to enable the VK_LAYER_KHRONOS_validation layer at instance creation. In addition to the layer(s) to be enabled we also need to provide VkValidationFeaturesEXT with the VK_VALIDATION_FEATURE_ENABLE_DEBUG_PRINTF_EXT feature enabled:
void ShaderDebugPrintf::create_instance()
{
    ...

    // Shader printf is a feature of the validation layers that needs to be enabled
    std::vector<VkValidationFeatureEnableEXT>  validation_feature_enables = {VK_VALIDATION_FEATURE_ENABLE_DEBUG_PRINTF_EXT};

    VkValidationFeaturesEXT validation_features{VK_STRUCTURE_TYPE_VALIDATION_FEATURES_EXT};
    validation_features.enabledValidationFeatureCount = 1;
    validation_features.pEnabledValidationFeatures    = validation_feature_enables.data();
This then needs to be chained into the instance creation:
    std::vector<const char *> validation_layers = {"VK_LAYER_KHRONOS_validation"};

    VkInstanceCreateInfo instance_create_info{VK_STRUCTURE_TYPE_INSTANCE_CREATE_INFO};
    ...
    instance_create_info.pNext = &validation_features;
UPDATE: This sample now leverages an alternative mechanism provided by the Vulkan Samples framework to simplify enablement of the VK_LAYER_KHRONOS_validation layer and the VK_VALIDATION_FEATURE_ENABLE_DEBUG_PRINTF_EXT feature:
const std::vector<const char *> ShaderDebugPrintf::get_validation_layers()
{
	// Initialize validation layer override list to default (empty)
	std::vector<const char *> validation_layers = ApiVulkanSample::get_validation_layers();

	// Force activation of validation layer for access to debugPrintfEXT feature
	validation_layers.push_back("VK_LAYER_KHRONOS_validation");

	return validation_layers;
}
The VK_VALIDATION_FEATURE_ENABLE_DEBUG_PRINTF_EXT feature is enabled by the new VK_EXT_layer_settings extension which is supported by the Vulkan Samples framework and used during instance creation. If the layer settings extension is available at runtime, the Vulkan Samples framework will enable the requested debugPrintfEXT feature using the VkLayerSettingEXT structure shown below. If VK_EXT_layer_settings is not available at runtime, the sample falls back to the custom create_instance() logic described above.
ShaderDebugPrintf::ShaderDebugPrintf()
{
	...

	// If layer settings available, use it to configure validation layer for debugPrintfEXT
	add_instance_extension(VK_EXT_LAYER_SETTINGS_EXTENSION_NAME, /*optional*/ true);

	VkLayerSettingEXT layerSetting;
	layerSetting.pLayerName   = "VK_LAYER_KHRONOS_validation";
	layerSetting.pSettingName = "enables";
	layerSetting.type         = VK_LAYER_SETTING_TYPE_STRING_EXT;
	layerSetting.valueCount   = 1;

	// Make this static so layer setting reference remains valid after leaving constructor scope
	static const char *layerEnables = "VK_VALIDATION_FEATURE_ENABLE_DEBUG_PRINTF_EXT";
	layerSetting.pValues            = &layerEnables;

	add_layer_setting(layerSetting);
}
Displaying debug printf output in your application
If all you want to do is read the shader printf messages in a debugger like RenderDoc there’s no additional work involved. Simply run your application with above instance setup and a printf in your shader and you can read those messages. Or use VkConfig from the LunarG SDK to redirect the messages to a specific output.
But if you want to display or process those messages in your own application you need to do that via a debug messenger callback. This is pretty much the same as setting up such a callback for validation:
	VkDebugUtilsMessengerCreateInfoEXT debug_utils_messenger_create_info{VK_STRUCTURE_TYPE_DEBUG_UTILS_MESSENGER_CREATE_INFO_EXT};
	debug_utils_messenger_create_info.messageSeverity = VK_DEBUG_UTILS_MESSAGE_SEVERITY_INFO_BIT_EXT;
	debug_utils_messenger_create_info.messageType     = VK_DEBUG_UTILS_MESSAGE_TYPE_VALIDATION_BIT_EXT;
	debug_utils_messenger_create_info.pfnUserCallback = debug_utils_message_callback;

VK_CHECK(vkCreateDebugUtilsMessengerEXT(vulkan_instance, &debug_utils_messenger_create_info, nullptr, &debug_utils_messenger));|
Shader printf messages are of |
With the validation layers and feature enabled and a debug callback wired up, we can process or output the shader printf messages. The most basic option could look like this:
VKAPI_ATTR VkBool32 VKAPI_CALL ShaderDebugPrintf::debug_utils_message_callback(
    VkDebugUtilsMessageSeverityFlagBitsEXT      messageSeverity,
    VkDebugUtilsMessageTypeFlagsEXT             messageType,
    const VkDebugUtilsMessengerCallbackDataEXT *pCallbackData,
    void                                       *pUserData)
{
    std::cout << pCallbackData->pMessage << "\n";
	return VK_FALSE;
}
How you process those messages is up to you, in our sample we limit the output to the first invocation of a given draw call:
// Output the vertex position using debug printf
if (gl_VertexIndex == 0) {
    debugPrintfEXT("Position = %v4f", outPos);
}
And then gather those so they can be displayed in the graphical user interface. The sample also checks if it’s actually a printf message (pMessageIdName == WARNING-DEBUG-PRINTF), which is something one could do to distinguish between actual validation messages and printf outputs:
VKAPI_ATTR VkBool32 VKAPI_CALL ShaderDebugPrintf::debug_utils_message_callback(
    VkDebugUtilsMessageSeverityFlagBitsEXT      messageSeverity,
    VkDebugUtilsMessageTypeFlagsEXT             messageType,
    const VkDebugUtilsMessengerCallbackDataEXT *pCallbackData,
    void                                       *pUserData)
{
	if (strcmp(pCallbackData->pMessageIdName, "WARNING-DEBUG-PRINTF") == 0)
	{
		// Validation messages are a bit verbose, but we only want the text from the shader, so we cut off everything before the first word from the shader message
		// See scene.vert: debugPrintfEXT("Position = %v4f", outPos);
		std::string shader_message{pCallbackData->pMessage};
		shader_message = shader_message.substr(shader_message.find("Position"));
		debug_output.append(shader_message + "\n");
	}
	return VK_FALSE;
}
Printf output buffer size
The default buffer size for debug outputs is limited. If you output a lot of messages, e.g. by doing a printf per fragment shader invocation, this may not suffice and you’ll get a validation warning telling you about the buffer being to small. This buffer size can be increased via the VkConfig utility from the LunarG SDK. See this whitepaper for details on that.
|
This does not apply to outputting messages in graphics debuggers. |
Memory considerations
Using debug printf will consume a descriptor set, so if you use every last descriptor set it may not work and you may need to increase the set count at pool allocation. Thus in the sample we allocate an additional set from the pool. It also consumes device memory based on the number and/or size fo the debug messages.
Printf in a graphics debugger
While displaying the printf messages directly in the application may be useful to a certain extent (low number of invocations or low frequency of information) the most interesting use case is to use it in combination with a graphics debugger like RenderDoc.
If we remove the sample’s limitation to output only for the first invocation by changing scene.vert from:
// Output the vertex position using debug printf
if (gl_VertexIndex == 0) {
    debugPrintfEXT("Position = %v4f", outPos);
}
to this:
debugPrintfEXT("Position = %v4f", outPos);And then run the sample in RenderDoc we now get a list of all shader debug printf messages for all invocations:
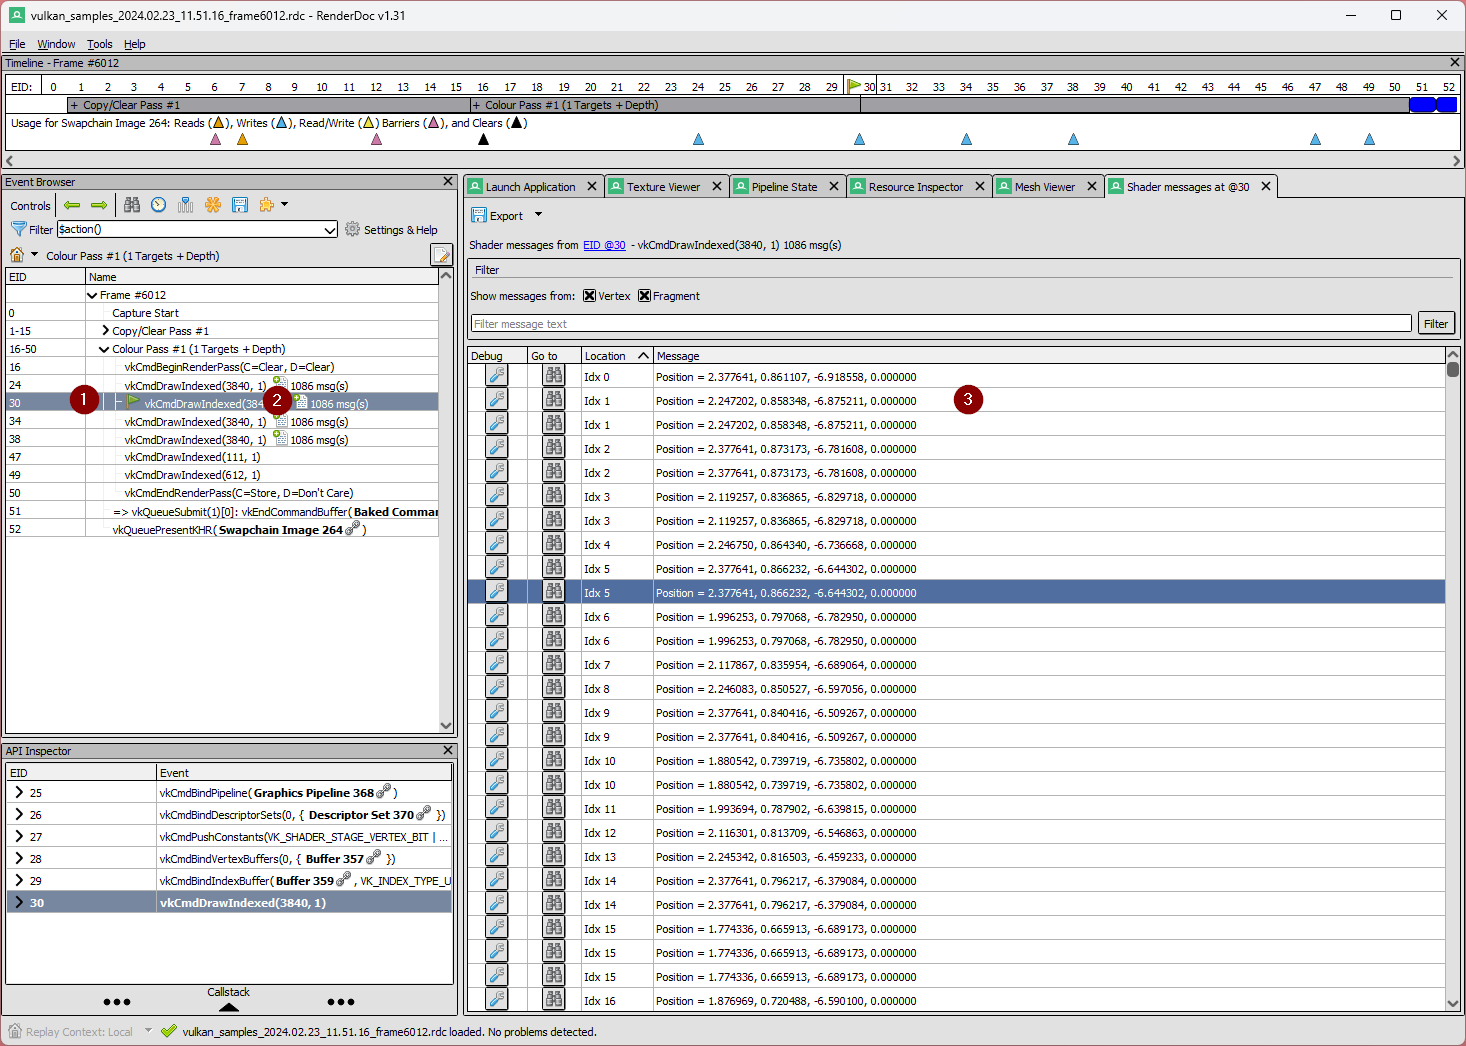
Selecting a draw call with at least one debug message on the Event browser will show a label with the no. of messages for that draw call (e.g. 1250 msg(s)). Clicking on such a label will open the list of messages for that draw call. From here you can navigate to e.g. the mesh viewer for a given vertex (in the case of a vertex shader) or the texture view (in the case of a fragment shader).